 By Simon Buddle, Future Ready Homes.
Whilst researching for an opening to this article, I did the usual Internet trawling to find some inspiration. Here were the top Google results for ‘Power’:
‘Should Donald Trump Have Power to Launch Nuclear Missiles?’ – an article in Time magazine.
‘Donald Trump betting odds’ – from the bookmaker, Paddy Power, on which year Kim Jong-Un will cease to be Supreme Commander.
Not exactly what I had in mind.
My obsession with power is more along the lines of how keen everyone is to know their energy consumption; how much they use, how much it costs and where money can be saved. Providing accurate figures will mean making a few choices about product, granularity of data, how the data is displayed and importantly, how the data is stored.
Product choice
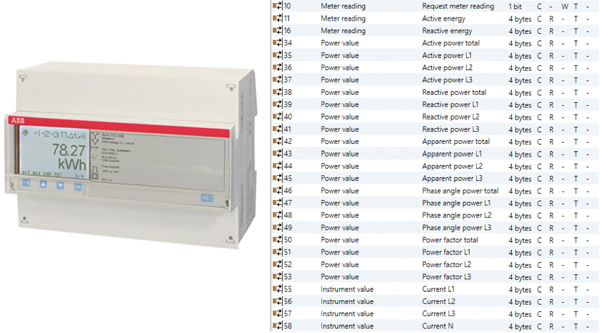
If customers are only looking to understand roughly what they consume, then the Zennio KES Plus works perfectly. With three inputs you can measure up to 120 amps. It also has connections to reference the voltage. ABB does a range of excellent energy meters, most of which need an interface to connect to the KNX bus.
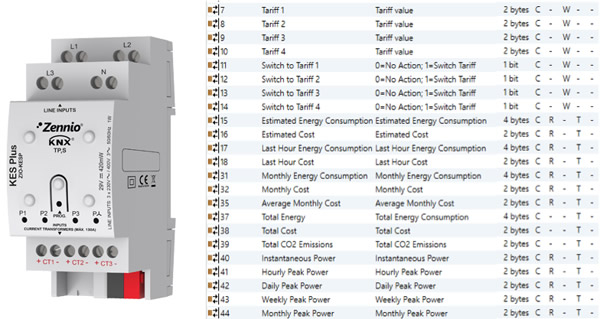
Our choice of product should also consider what it is that the customer wishes to see. Is it money spent, energy usage or both? Not all products provide all of that information directly through their Group Objects, which means that we may have to do some maths somewhere in the system before displaying the data. We’ll come back to that.
Granularity of data
This is a point of serious discussion with the customer. If you want to display home consumption, then the readings must be taken at the point of entry into the home, i.e. after the utility company meter, but before the consumer unit. That will give us a total load reading for the entire property. However, if they are looking to understand, for example, the swimming pool running costs, then the meter should be located at the pool’s electrical control unit. The simple and obvious rule is that the meter will read energy downstream of it, but not upstream. Therefore, to be accurate, you must be sure that only devices/circuits you want to measure are downstream of the meter.
Displaying data
This might generally be broken down in to three sections:
• Simple cost per hour – how much am I using right now?
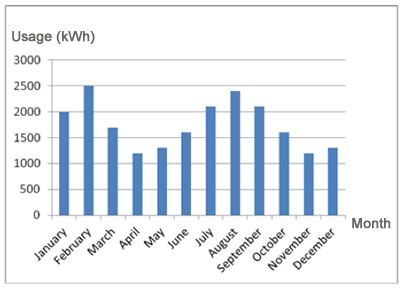
• Monthly bar graphs – what does my month-on-month energy profile look like?
• An active rolling graph showing usage in real time.
So, we’ve asked our customer a lot of questions, and now we’re ready to decide on product.
Some maths
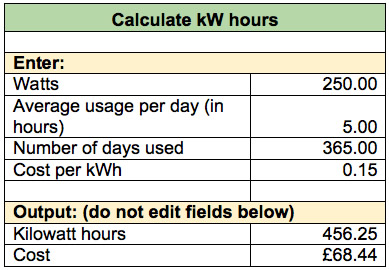
If we know the energy consumed but the KNX device doesn’t output the cost, we’ll need to do that ourselves. We need the unit cost per kilowatt hour (kWh). The price will be on the customer’s utility bill. For electricity in the UK, for example, it is likely to be in the range of 10-15 pence per kWh. For gas, that figure is considerably lower, around 4-7 pence. Watch out for increased costs at peak time! If the cost or tariff isn’t the same all day, you’ll need a device that allows you to switch between tariffs or be able to calculate that yourself using the following formula:
Unit price x kWh = cost
The table below shows the cost in GBP (British pounds) for a year’s electricity for a device that uses 250W and runs for 5 hours per day, 365 days per year.
Some physics
You may see, as part of certain products’ Group Objects, power noted as; Active Power, Reactive Power and Apparent Power. But what do these all mean?
Active Power performs the actual work, i.e. it creates light, heat or motion.
Reactive Power doesn’t perform work, but is used to charge capacitors or create magnetic fields around a coil.
Apparent Power is the sum of active and reactive, and is the figure that is important if we are measuring energy costs.
All three are measured in watts and therefore can easily be converted into kWh for costing purposes. If the KNX device can send out the Apparent Power every cycle, then you are able to plot that as a real-time graph for the customer.
Data storage
The data sent to the bus only exists until the next update, of course, so we need to store data cumulatively and be able to recall or extract it later, probably monthly. That will require a computer of some description, possibly a Gira Home Server or a Comfort Click Jigsaw unit. From there, it is easy to format the data to be exported in Excel or XML.
Conclusion
Customers often throw in the idea that they would like to know the energy usage of the home. We must explore what they mean, or rather want, in terms of information before deciding on which products to use. Even then, we may be faced with some challenges when trying to provide the correct data, but with the right knowledge, a bit of maths and some understanding of physics, we can present them with almost limitless data on their energy usage, and put the power back in their hands.
Simon Buddle is a consultant for Future Ready Homes, a specialist in BMS and ELV services system design.